 Live Chat
 Log In

What Is ProxyVero? A Practical Guide to Independent Proxy Benchmark Data
When choosing a proxy provider, it is easy to get overwhelmed by numbers. Millions of IPs. Hundreds of countries. High uptime. Fast response times. High success rates. Low prices.
The problem is that every provider presents these numbers differently, which makes it difficult to compare services using the same standard.
ProxyVero is an independent proxy intelligence platform designed to make those comparisons more useful. It focuses on real-world proxy testing, benchmark data, provider comparisons, traffic cost analysis, and research reports.
Rather than relying only on provider-reported specifications, ProxyVero sends real HTTP(S) requests through proxy networks and measures how they perform against defined targets.
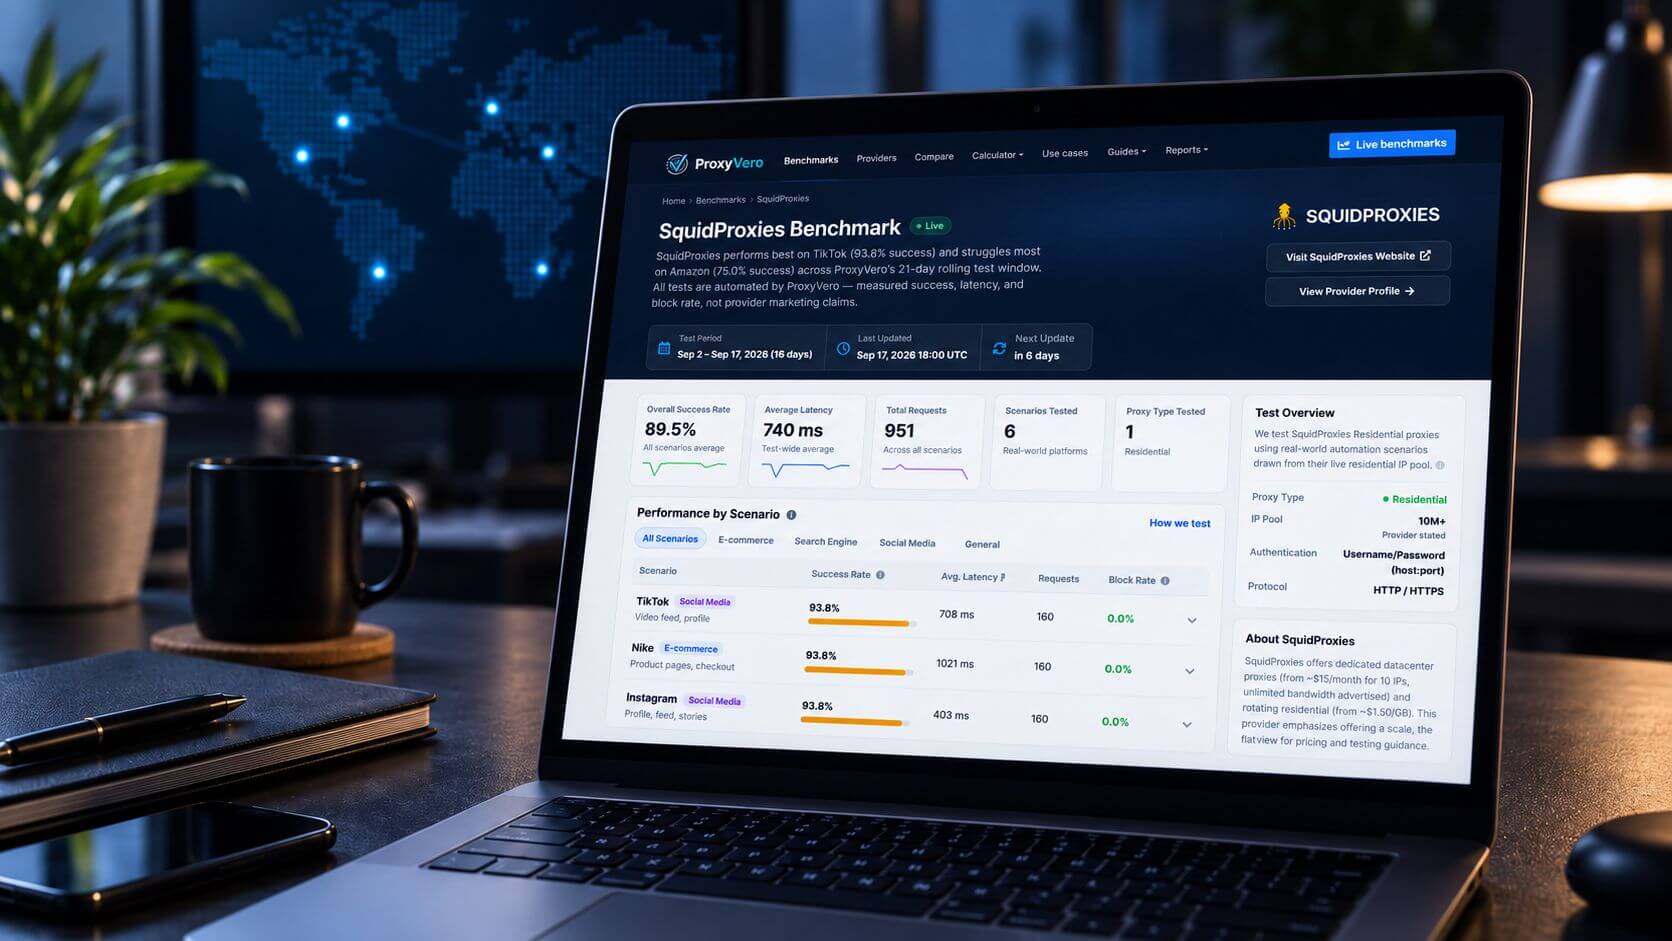
Squid Proxies is now part of that testing program. Its residential proxy network is included in ProxyVero's benchmark runs, giving users an independent view of how Squid Proxies performs across different websites and how those results compare with other residential proxy providers.
Benchmark note: ProxyVero's live benchmark data changes as new tests are completed. The detailed Squid Proxies figures in this article refer to the benchmark window from September 2 through September 16, 2026. For current measurements, check the live Squid Proxies benchmark.
Why Proxy Benchmarking Matters
A proxy provider's specifications can tell you a lot about its infrastructure, but they do not necessarily show how that infrastructure will perform against a particular website.
A proxy network may work almost perfectly against a basic HTTPS endpoint but experience more blocks, timeouts, or slower response times against Google, Amazon, or a social platform.
Performance can be affected by:
- IP reputation
- Target website
- Geographic location
- Routing
- Session behavior
- Request patterns
- Anti-automation systems
- Changes to the target website
This is why a single number such as "99% success rate" has limited value without context.
Success against which target? From which location? Over how many requests? Using which proxy type?
ProxyVero's August 2026 report illustrates the difference. Across 50 residential proxy providers, the average success rate on a generic HTTPS endpoint was 98.4%. On Google Search, the average dropped to 44.5%, with a 54.2% block rate.
The same networks that performed very well on a simple endpoint encountered much more difficulty on a heavily protected target.
That is why ProxyVero focuses on scenario-level performance rather than relying only on advertised specifications.
How ProxyVero Tests Proxy Providers
According to ProxyVero's testing methodology, providers within the same scenario are tested using the same script, target, classification rules, and timeout settings.
The platform tracks metrics including:
- Success rate
- Average latency
- P95 latency
- Block rate
- Connection failures
- Timeouts
- Request volume
- Scenario-specific performance
Success criteria depend on the target.
For a basic HTTPS endpoint, a successful request may require a valid HTTP 200 response with content. For Google, ProxyVero also checks for block-like responses such as CAPTCHA or unusual-traffic pages.
This distinction matters because a request can technically return an HTTP response while still failing to deliver the intended content.
ProxyVero also separates provider-reported information from independently measured benchmark data.
An advertised IP pool size is provider-supplied information.
A success rate calculated from actual test requests is independently measured data.
Both are useful, but they answer different questions.
How Squid Proxies Was Tested
ProxyVero tested the Squid Proxies residential proxy network using real HTTP(S) requests through its live residential IP pool.
For the September 2-16 benchmark period, ProxyVero recorded:
- Proxy type: Residential
- Protocol: HTTP/HTTPS
- Authentication: Username/password via host:port
- Scenarios tested: 6
- Measured requests: 891
- Testing period: 15 days
Only the residential network was included in this test.
Squid Proxies also offers dedicated datacenter proxies, but the results discussed here should not be applied to that product.
The six test scenarios were:
| Scenario | Test Target | What It Helps Measure |
|---|---|---|
| Google Search | U.S. SERP for "best running shoes" | Search access and blocking |
| Amazon | Product/inventory page | E-commerce access |
| Profile page | Social platform access | |
| TikTok | Profile page | Social platform access |
| Nike | Retail product page | Retail/e-commerce access |
| Generic HTTPS | api.ipify.org | Basic connectivity |
These scenarios represent very different levels of filtering and anti-automation behavior, which makes them more informative than testing only basic connectivity.
Squid Proxies Benchmark Results
Across the 891 requests, ProxyVero measured:
- 89.3% overall success rate
- 747 ms average latency
- 1,415 ms P95 latency
- 3.9% overall block rate
The per-scenario results show where those numbers came from:
| Scenario | Success Rate | Avg. Latency | Requests | Block Rate |
|---|---|---|---|---|
| TikTok | 93.3% | 712 ms | 150 | 0.0% |
| 93.3% | 400 ms | 150 | 0.0% | |
| Nike | 93.3% | 1,032 ms | 150 | 0.0% |
| Generic HTTPS | 92.9% | 406 ms | 140 | 0.0% |
| Google Search | 86.8% | 226 ms | 151 | 6.6% |
| Amazon | 76.7% | 1,843 ms | 150 | 16.7% |
Source: ProxyVero Squid Proxies benchmark, September 2-16, 2026.
The most important observation is that performance varied significantly by target.
Instagram and TikTok
Instagram and TikTok were among the strongest measured scenarios.
Instagram recorded:
- 93.3% success
- 400 ms average latency
- 0% block rate
TikTok also recorded:
- 93.3% success
- 712 ms average latency
- 0% block rate
Both reached the same success rate, but Instagram responded considerably faster.
This is a useful reminder that success rate and latency measure different things.
Nike
Nike also produced a 93.3% success rate with a 0% block rate.
Its average latency was higher, at 1,032 ms.
Again, the success rate matched Instagram and TikTok, but the response time differed significantly.
For higher-volume workloads, that difference can affect throughput and completion time even when the final success percentages are similar.
Google Search
Google produced a different pattern.
Across 151 requests, ProxyVero recorded:
- 86.8% success
- 226 ms average latency
- 6.6% block rate
- 10 blocked requests
- 7 timeouts
- 3 connection failures
Google had the lowest average latency of all six scenarios, but not the highest success rate.
That demonstrates an important point:
A fast response is not always a successful response.
For SERP monitoring and other search workloads, a CAPTCHA or block page can still arrive quickly.
That means latency, success rate, and block rate should be evaluated together.
Squid Proxies also covers this use case in its guide to local SEO monitoring with residential proxies.
Amazon
Amazon was the most challenging scenario in this test.
ProxyVero recorded:
- 76.7% success
- 1,843 ms average latency
- 16.7% block rate
- 25 blocked requests
- 7 timeouts
- 3 connection failures
Amazon had both the lowest success rate and highest average latency of the six targets.
This does not mean Squid Proxies will always produce a 76.7% Amazon success rate.
It means that under ProxyVero's September test conditions, Amazon created more difficulty than the other tested targets.
For users evaluating residential proxies for e-commerce monitoring or similar workloads, this is the kind of target-specific result worth testing further before scaling.
Generic HTTPS as a Baseline
The generic HTTPS scenario produced:
- 92.9% success
- 406 ms average latency
- 0% block rate
Compare that with Amazon's 76.7% success and 16.7% block rate.
The proxy network is the same. The target is different.
This is why a basic connectivity test alone cannot describe real-world proxy performance.
What the Results Tell Us
The Squid Proxies benchmark shows why the per-target breakdown matters more than the overall 89.3% figure.
During the test window:
- TikTok: 93.3%
- Instagram: 93.3%
- Nike: 93.3%
- Generic HTTPS: 92.9%
- Google Search: 86.8%
- Amazon: 76.7%
ProxyVero recorded no blocked responses for TikTok, Instagram, Nike, or generic HTTPS. Google recorded a 6.6% block rate, while Amazon recorded 16.7%.
The key takeaway is simple:
Proxy performance is workload-specific.
A provider that performs well on one target may produce different results on another.
How Does Squid Proxies Compare With Nearby Competitors?
ProxyVero's broader benchmark database provides additional context.
Around the same September period, several residential proxy providers produced overall success rates close to Squid Proxies:
| Provider | Overall Success | Avg. Latency | Requests |
|---|---|---|---|
| Smartproxy | 89.4% | 1,079 ms | 1,260 |
| Squid Proxies | 89.3% | 747 ms | 891 |
| Geonode | 88.7% | 1,351 ms | 1,260 |
| ProxyRack | 88.6% | 1,306 ms | 1,260 |
| LumiProxy | 88.0% | 1,398 ms | 1,260 |
Smartproxy was the closest provider by overall success rate in these snapshots, at 89.4% compared with 89.3% for Squid Proxies.
Geonode, ProxyRack, and LumiProxy were also within a relatively narrow range.
Squid Proxies' 747 ms average latency was lower than the nearby providers shown above in their respective benchmark windows.
However, these figures should not be treated as a permanent ranking.
The test periods and sample sizes are not identical. Squid Proxies had 891 requests across 15 days, while several of the other providers had 1,260 requests across longer windows.
The table is therefore most useful for identifying providers in a similar performance range rather than declaring a permanent winner.
For current data, see the ProxyVero benchmark leaderboard.
Why Sample Size Matters
A percentage means more when you know how many requests produced it.
A provider that completes 20 out of 20 requests can show a 100% success rate, but that is less informative than a result maintained across hundreds or thousands of requests.
The Squid Proxies benchmark was based on 891 measured requests, with roughly 140 to 151 requests per scenario.
ProxyVero also applies request thresholds to its monthly rankings. In its August report, providers needed a minimum number of measured requests to qualify for the ranked Top 10.
This helps prevent very small samples from being treated as equivalent to larger datasets.
Live Benchmarks vs. Monthly Reports
ProxyVero publishes both live benchmark data and monthly reports.
The distinction matters.
The live benchmark is designed to reflect recent provider performance and can change as new test results enter the dataset.
The monthly reports preserve fixed historical periods.
The August 2026 report, for example, covers August 1-31 rather than a moving window.
This makes monthly reports useful for tracking changes over time.
The Squid Proxies figures in this article are a dated September benchmark snapshot, not a September monthly report or a permanent performance specification.
Comparing Providers With ProxyVero
ProxyVero also provides a comparison tool that lets users evaluate providers using metrics such as:
- Success rate
- Latency
- Block rate
- Price
- IP pool
- Geographic coverage
This matters because different users have different priorities.
A developer may care most about reliability.
A large data collection workload may prioritize success rate and cost.
A smaller business may care more about pricing.
There is no single weighting that works for every use case.
Understanding Proxy Traffic Cost
Performance is only one part of proxy selection.
For high-volume workloads, bandwidth costs can become significant.
ProxyVero's traffic cost calculator estimates how much traffic a particular workload generates and how that translates into provider costs.
This is useful because the cheapest price per gigabyte is not always the cheapest way to complete a job.
A lower-priced proxy that generates frequent failed requests and retries may ultimately consume more bandwidth than a more reliable network.
Performance and cost are therefore better evaluated together.
Downloadable Data and Live Widgets
ProxyVero also makes benchmark data available beyond the leaderboard.
Where available, monthly datasets can be downloaded in CSV or JSON format, allowing developers, researchers, publishers, and providers to perform their own analysis.
ProxyVero also provides Data Widgets that let publishers and providers embed live benchmark information.
This is particularly useful for continuously changing data.
A static article can preserve a dated benchmark snapshot, while a live widget can show newer results as additional tests are completed.
The Squid Proxies benchmark page provides the latest measurements.
ProxyVero Is Not a Proxy Seller
ProxyVero does not sell proxy bandwidth.
Its focus is proxy intelligence, benchmarking, provider comparisons, data tools, and research.
That separation matters when interpreting its results.
ProxyVero's methodology is designed to apply the same measurement rules across providers within each benchmark scenario.
At the same time, no benchmark should be treated as a guarantee.
Proxy performance can vary based on:
- Geography
- Target website
- Proxy type
- Routing
- Session configuration
- IP availability
- Request behavior
- Time period
- Sample size
A benchmark is evidence of what happened under defined conditions, not a promise that every user will reproduce exactly the same result.
A Useful Data Source for Providers, Too
Benchmark data can also help proxy providers identify where their networks perform well and where they may need improvement.
The Squid Proxies test provides a good example.
During the September benchmark window, the network performed strongly on Instagram, TikTok, Nike, and generic HTTPS. Google experienced some blocking, while Amazon produced the weakest result.
Future benchmark runs can show whether those patterns change.
In this way, ProxyVero's data is not only useful to buyers. It can also act as an additional source of operational feedback for providers.
Where ProxyVero Fits in the Research Process
The proxy industry contains information from many sources.
Providers publish specifications. Review websites publish comparisons. Developers share practical experiences. Researchers collect their own data.
ProxyVero adds another layer: structured performance data collected using a consistent benchmark framework.
For someone evaluating Squid Proxies, a practical process is:
- Review provider specifications and available proxy products.
- Examine independent benchmarks for workloads similar to your own.
- Compare relevant alternatives.
- Test your actual production targets before scaling.
No single source should replace the others.
Final Thoughts
Proxy selection has become more complicated as networks have expanded, pricing models have changed, and target websites have become more sophisticated.
That makes independent benchmark data increasingly useful.
ProxyVero's approach is to test proxies against real-world scenarios, publish its methodology, maintain historical datasets, provide comparison tools, and make benchmark information available for further analysis.
The Squid Proxies test shows why that approach matters.
Across 891 residential proxy requests during the September 2-16 benchmark period, ProxyVero measured an 89.3% overall success rate, 747 ms average latency, and a 3.9% block rate.
But the more important finding was the variation by target.
TikTok, Instagram, and Nike each achieved 93.3% success. Generic HTTPS reached 92.9%. Google reached 86.8%, while Amazon reached 76.7%.
Those results show why proxy performance should not be reduced to a single number.
The more useful question is:
How does the network perform on the websites and workloads I actually plan to use?
Independent benchmarks can help answer that question, but your own workload testing should still be the final step.
For current measurements, see the live Squid Proxies benchmark or browse the ProxyVero benchmark leaderboard.
Related Articles

The State of Residential Proxies in 2026: Trends and Market Shifts
A practical 2026 market guide for residential proxies: what’s changing, how to size your mix vs. datacenter IPs, and how to validate quality, control cost, and reduce risk.